Time Series Analysis in Pandas

What is Time Series Analysis?
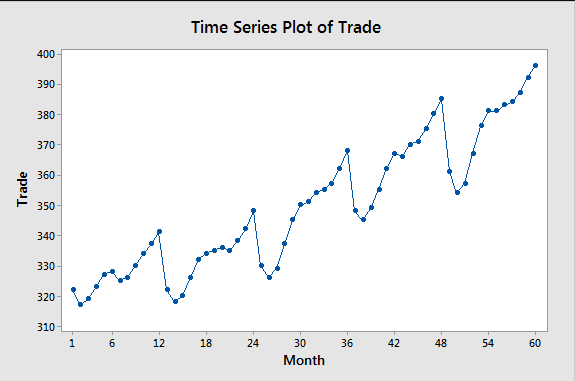
Time series analysis involves statistical techniques to analyze time-ordered data points. It helps in identifying trends, seasonal patterns, and forecasting future values based on historical data.
Why Use Pandas for Time Series Analysis?
Pandas is a powerful Python library that simplifies data manipulation and analysis. It offers robust tools to handle time series data, allowing for easy data cleaning, manipulation, and visualization.
Example: Creating and Analyzing Time Series Data
Let’s create a simple time series dataset and perform some basic analysis.
import pandas as pd

# Create a time series
date_rng = pd.date_range(start='2020-01-01', end='2020-12-31', freq='D')
data = pd.DataFrame(date_rng, columns=['date'])
data['data'] = pd.Series(range(1, len(data) + 1))

# Set date as index
data.set_index('date', inplace=True)

# Display the first few rows
print(data.head())
This code imports the Pandas library and creates a time series of daily dates from January 1, 2020, to December 31, 2020. It then constructs a DataFrame containing these dates and a corresponding numerical series. Finally, it sets the date as the index of the DataFrame for easier data manipulation and prints the first few rows.
Visualizing Time Series Data
Visualizing data can help identify trends and patterns more easily. Below is an interactive button that will show a sample time series data table when clicked.
Moving Averages and Trend Analysis
One of the common techniques in time series analysis is calculating moving averages to smooth out short-term fluctuations and highlight longer-term trends.
# Calculate moving average
data['moving_average'] = data['data'].rolling(window=7).mean()
print(data.head(10))
This code calculates the 7-day moving average of the 'data' column in the DataFrame. The rolling function creates a moving window of 7 days, and the mean function calculates the average for that window. The result is stored in a new column called 'moving_average', which helps identify trends in the time series data.
Resampling Time Series Data
Resampling allows you to change the frequency of your time series data. You can upsample (increase frequency) or downsample (decrease frequency) the data. Here’s how to downsample to a monthly frequency:
# Downsample to monthly frequency
monthly_data = data.resample('ME').sum()
print(monthly_data)
This code uses the resample method to change the frequency of the data from daily to monthly. The 'ME' parameter indicates that we want monthly data, and the sum function aggregates the daily values into monthly totals. The result is stored in a new DataFrame called 'monthly_data'.
Conclusion
Time series analysis is a powerful tool for making sense of data over time. Using Pandas simplifies the process of data manipulation, making it easier to analyze trends and forecast future values. Start exploring your time series data today!
